Status Page using Collectd, InfluxDB and Grafana
981 words, 5 minutes
Collectd is already grabbing statistics from my services and drop them into InfluxDB so that I can get pretty graphes with Grafana. One thing I miss is a single page that shows the overall status for all those systems ; somehow also known as Status Page.
Overview
Each servers have a collectd instance running. Collectd checks if some processes are running, alert me when it’s not the case and write the test results into InfluxDB.
I use a simple test : if a process is running, then the service is considered UP. There are many cases when this is wrong. But I’ve run Monit this way for ages and it covers 99% of the needs. Later on, I’ll see how to run tests that include protocol dialog and response time in the status page.
I use the collectd “processes” plugin to get statistics about cared daemons and the “exec” and “threshold” plugins to get email and SMS notifications.
Collectd: monitor the daemons
At the time of writing, my OpenBSD and Linux machines ship with collectd 5.8.1. Other versions might not work as described.
Listing the monitored daemons
The daemons are monitored using the “processes” plugin:
<Plugin processes>
    ProcessMatch "cron"     "/usr/sbin/cron"
    ProcessMatch "dhcpd"    "/usr/sbin/dhcpd"
    ProcessMatch "ntpd"     "/usr/sbin/ntpd"
    ProcessMatch "pflogd"   "pflogd:.*priv"
    ProcessMatch "smtpd"    "/usr/sbin/smtpd"
    ProcessMatch "sshd"     "/usr/sbin/sshd.*listener"
    ProcessMatch "syslogd"  "/usr/sbin/syslogd"
</Plugin>
This will gather informations such as number of matching instances, process state and ressource usage. Full description is available in collectd.conf(5).
Raising alerts
Using the “threshold” plugin, collectd will react when the gathered values are out of range and raise an alert. See collectd-threshold(5) for more informations.
<Plugin "threshold">
    <Plugin "processes">
        <Type "ps_count">
            FailureMin  1
            Persist     false
            PersistOK   false
            Interesting true
        </Type>
    </Plugin>
</Plugin>
As soon as collectd will not find at least one instance of a process, it will raise a Failure error. I don’t want to be flooded with notifications so I only get one when a status changes : one for failure, one for recovery.
Sending notifications
Notifications are achieved using the “exec” plugin. Read about it in collectd-exec(5). The “NotificationExec” primitive defines scripts that will be executed when collectd raises an alert.
<Plugin exec>
    NotificationExec _collectd "/home/scripts/collectd-notif.sh"
</Plugin>
The script itself has to decide if it does something or not depending on the context and information it gets. In my case, I parse the data provided by collectd to extract criticity, process name, etc. Then an email is built and sent. Finally, an SMS is built and sent too.
#!/bin/ksh

PATH="/bin:/sbin:/usr/bin:/usr/sbin:/usr/local/bin:/usr/local/sbin"

set -A _msg

# Parse STDIN and set variables
while read _l; do
    case $_l in
        Severity:*)       _severity=${_l##*Severity: } ;;
        Host:*)           _host=${_l##*Host: } ;;
        Plugin:*)         _instance=${_l##*Plugin: } ;;
        PluginInstance:*) _instance=${_l##*PluginInstance: } ;;
    esac
    _msg[${#_msg[*]}+1]=$_l
done < /dev/stdin

IFS='
'

# Send notification email
printf "%s\n" ${_msg[@]} | \
mailx -s "$COLLECTD_HOSTNAME: $_severity $_instance" <em><insert email here></em>

# Send notification SMS (URL encoded message)
_msg="$COLLECTD_HOSTNAME: $_severity $_instance"
_cnt="$(echo $_msg | xxd -p -c1 | sed -e 's/^/%/' | tr -d '\n')"
curl -s "https://platform.clickatell.com/messages/http/send?\
apiKey=<em><insert apiKey here></em>&\
to=<em><insert phone number here></em>&\
content=$_cnt"

exit 0
#EOF
Once (re)started, collectd(1) will now monitor the daemons and hopefully send me a notification should they die or recover.
InfluxDB data
My collectd instances send data to a remote InfluxDB instance using the “network” plugin. The configuration was described here so I won’t cover it. I’ve added encryption and authentication since then but the overall configuration is still the same. There are a few “processes_*” measurements created by collect. To achieve the Status Page, I only use processes_processes which looks like this:
> SHOW TAG KEYS FROM "processes_processes"
name: processes_processes
tagKey
------
host
instance
type

> SHOW FIELD KEYS FROM "processes_processes"
name: processes_processes
fieldKey fieldType
-------- ---------
value float

> SELECT * FROM "processes_processes" ORDER BY time DESC
name: processes_processes
time                           host      instance type     value
----                           ----      -------- ----     -----
(...)
2020-06-30T07:48:50.454175014Z openbsd   sshd     ps_count 1
2020-06-30T07:48:50.454124918Z openbsd   smtpd    ps_count 1
2020-06-30T07:48:50.454072335Z openbsd   pflogd   ps_count 1
2020-06-30T07:48:50.454024918Z openbsd   sshguard ps_count 3
(...)
2020-06-30T07:51:16.476118487Z linux     smtpd    ps_count 1
2020-06-30T07:51:16.476051395Z linux     ntpd     ps_count 0
2020-06-30T07:50:46.476896603Z linux     sshd     ps_count 1
2020-06-30T07:50:46.476838419Z linux     rsyslogd ps_count 1
(...)
When “ps_count” is 0, then no program matched the “ProcessMatch” wildcard ; which means that the program doesn’t run. When the program has threads or sub-processes that weren’t excluded by “ProcessMatch”, then “ps_count” is a number greater than 1.
This means that one could also raise an alert if the process number gets to high or too low. In my case, I only deal with “ps_count” being 0 or not.
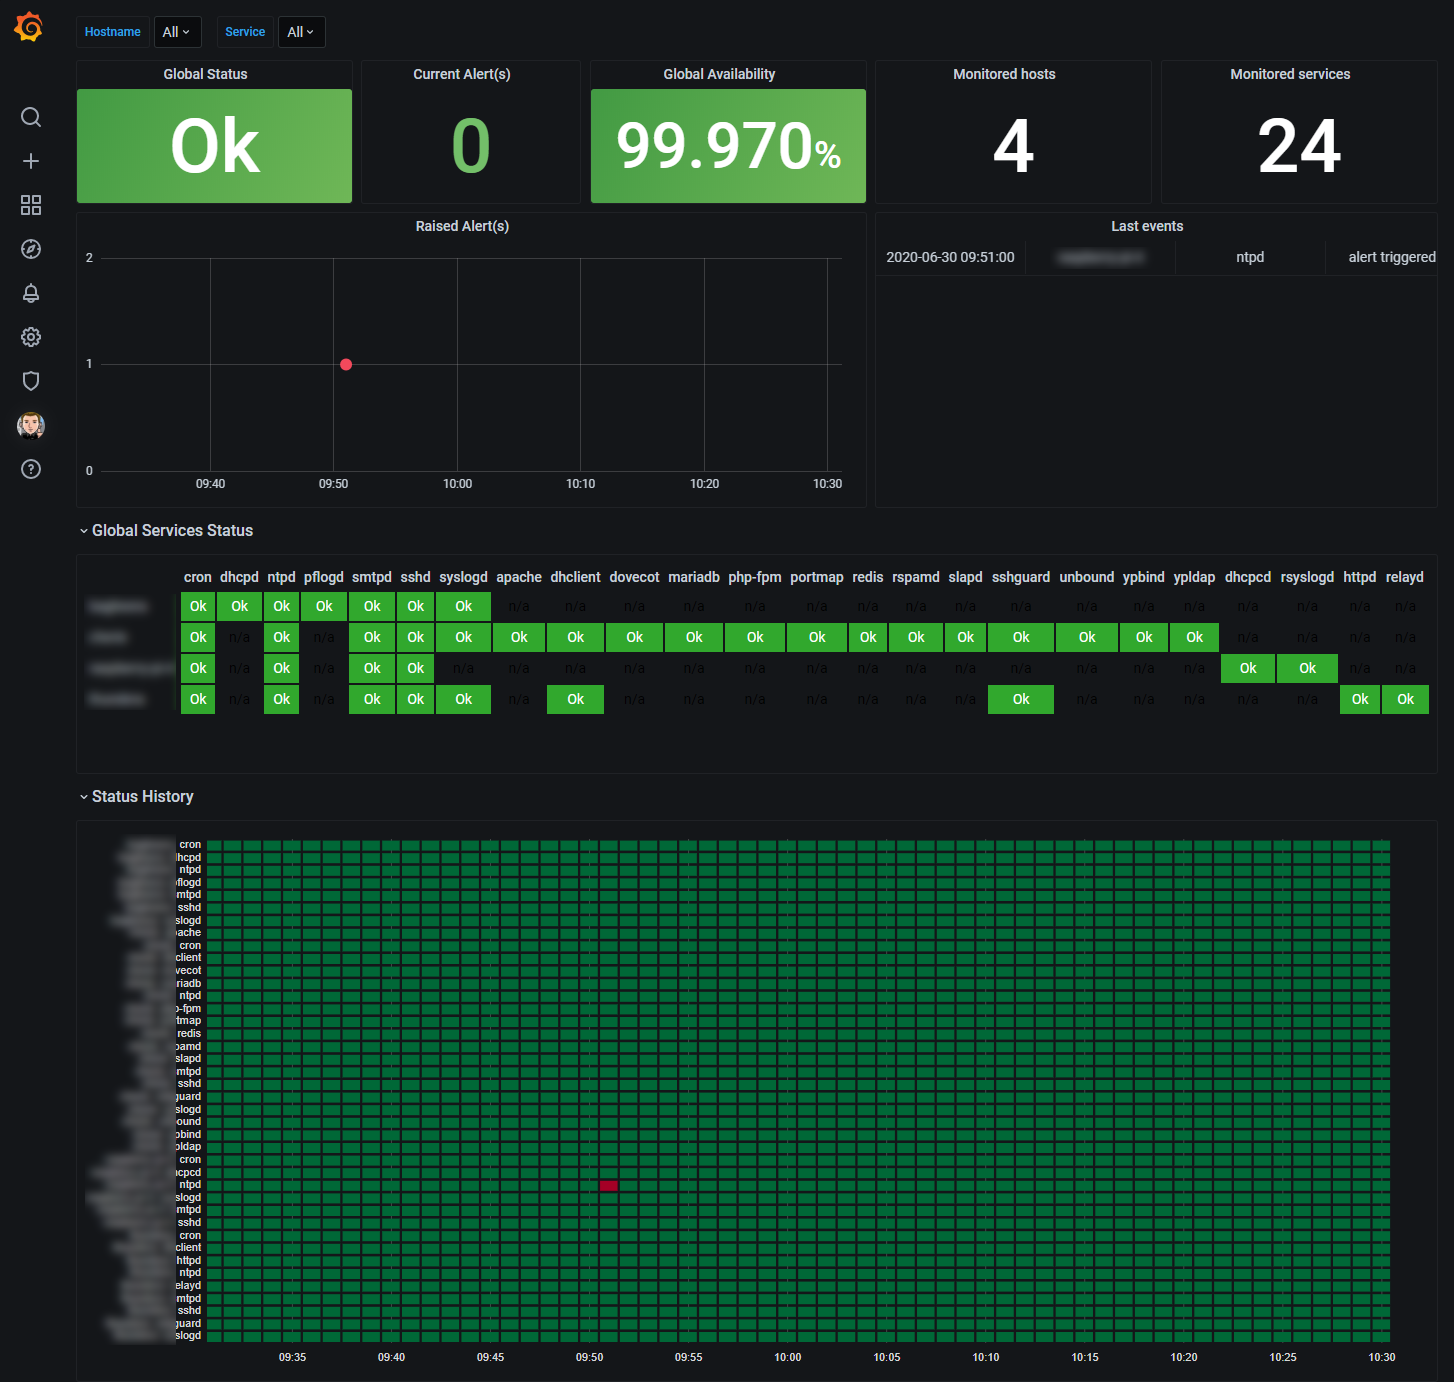
Grafana Status Page
The Grafana dashboard allows a global view on received metrics. Variables are configured to be able to select a limited number or host or services. I only have a few machines but I expect the detailed view to be quite messy when 1000 monitored servers are rendered.
My dashboard uses Stat, Graph, Table, Boom Table and Statusmap visualization modules.
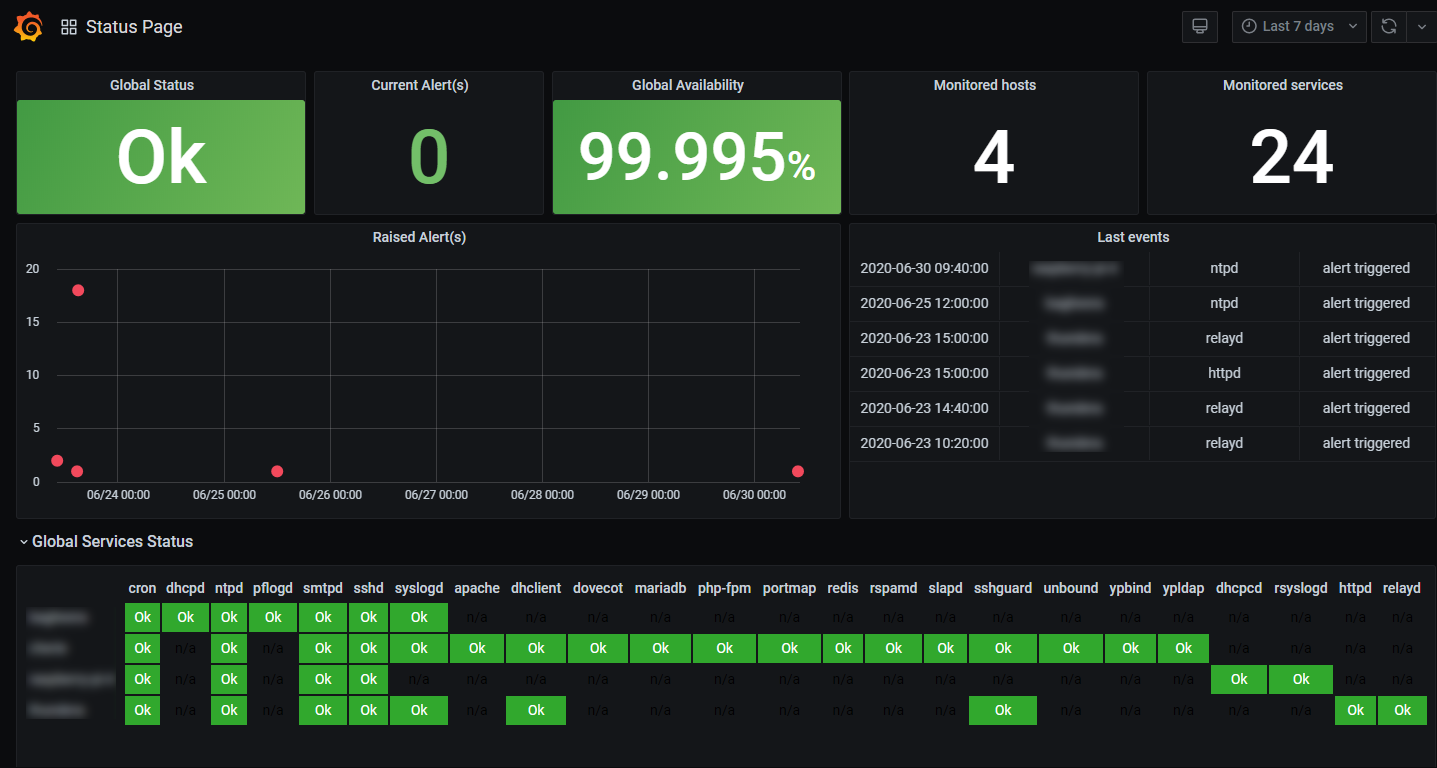
The dashboard is available on Grafana Labs dashboard section .
Final thoughts
So far, it seems to work pretty well. Collectd sends notifications when things go wrong ; I’ve added thresholds for CPU load too. I kept Monit running for a while just to compare and they both send the notifications when it was needed. I can now turn it off.
During my testings I faced two problems. Because of networking issues, collectd was unable to reach InfluxDB. It was still able to send notifications though. So only the Status Page was impacted. The second issue I got once was collectd silently died on a server. Neither notification nor Status Page updates were available until I noticed it looking at the statusmap panel.
Both issues could be detected using Grafana alerting feature. It should be configured to send a notification if data are suddenly not available. As for now, I couldn’t achieve a proper way to implement it. Got to work on it…
That’s all folks. Happy observability!