Monitoring GoToSocial using collectd and VictoriaMetrics
1251 words, 6 minutes
Some time ago, I adopted VictoriaMetrics as a replacement for Prometheus; which was already replacing InfluxDB. And recently, I realized that GoToSocial was exposing metrics in Prometheus format . So I decided to build a Grafana dashboard to keep an eye on my GtS instance.
Running VictoriaMetrics
The installation and usage of VictoriaMetrics on OpenBSD (7.7) is dead simple, given that a package already exists.
# pkg_add victoriametrics
Documentation is available online . You should probably take a moment to read it.
VictoriaMetrics seem to not be using a config file but only command line
parameters. I want to store VM data into the /home mountpoint and be
able to receive metrics from my (already running) collectd instances. So
I have enabled the Graphite listener.
# mkdir -m 750 /home/vmetrics
# chown _vmetrics:_vmetrics /home/vmetrics

# rcctl enable vmetrics
# rcctl set vmetrics flags -storageDataPath=/home/vmetrics \
  -retentionPeriod=3y -graphiteListenAddr=:2003  \
  -graphite.sanitizeMetricName

# rcctl start vmetrics
Sending collectd data to VictoriaMetrics
My system monitoring metrics come from collectd ; because I’m an old SysAdmin, but also because collectd runs on a diversity of operating systems in a coherent way. Using collectd, I get the exact same metrics using the same organized layout on OpenBSD, FreeBSD, NetBSD, OmniOS, Debian GNU/Linux and Alpine Linux. And I can also get Pushover notifications if something weird or unexpected happens on the servers. Anyway, back to the suject :)
This is were the Graphite
compatibility
gets handy. In every relevant collectd.conf configuration files,
I enabled the write_graphite module and set the parameters.
# vi collectd.conf
(...)
<Plugin write_graphite>
  <Node "victoriametrics">
    Host "192.0.2.666"
    Port "2003"
    Protocol "tcp"
    Prefix "collectd."
    UseTags true
  </Node>
</Plugin>
UDP can be used instead of TCP. But I prefer the later.
Defining a prefix allows metrics to be properly organized in
VictoriaMetrics. Also using UseTags allows getting context that can be
filtered when querying VictoriaMetrics’ content.
When the data will start flowing, one can explore it using cURL, for example.
# curl -s http://localhost:8428/api/v1/series?limit=3 -d
'match[]={__name__=~"collectd.*",host="victoria"}' | jq
{
  "status": "success",
  "data": [
    {
      "__name__": "collectd.cpu.count",
      "type": "count",
      "host": "victoria",
      "plugin": "cpu"
    },
    {
      "__name__": "collectd.cpu.percent",
      "type": "percent",
      "host": "victoria",
      "plugin": "cpu",
      "type_instance": "idle"
    },
    {
      "__name__": "collectd.cpu.percent",
      "type": "percent",
      "host": "victoria",
      "plugin": "cpu",
      "type_instance": "interrupt"
    }
  ]
}
If you are a Web GUI person, you can stil browse
http://localhost:8428/vmui.
Sending GoToSocial data to VictoriaMetrics
Metrics have to be enabled in the GoToSocial configuration. They are disabled by default.
$ vi /home/gotosocial/config.yaml
(...)
# Bool. Enable OpenTelemetry based metrics support.
# Default: false
metrics-enabled: true
Restart the GoToSocial daemon to apply the changes.
To check which metrics are available, simply use cURL.
# curl -s localhost:8080/metrics | egrep '^# (HELP|TYPE) '
# HELP go_sql_connections_closed_max_idle_time_total The total number of connections closed due to SetConnMaxIdleTime
# TYPE go_sql_connections_closed_max_idle_time_total counter
# HELP go_sql_connections_closed_max_idle_total The total number of connections closed due to SetMaxIdleConns
# TYPE go_sql_connections_closed_max_idle_total counter
# HELP go_sql_connections_closed_max_lifetime_total The total number of connections closed due to SetConnMaxLifetime
# TYPE go_sql_connections_closed_max_lifetime_total counter
# HELP go_sql_connections_idle The number of idle connections
# TYPE go_sql_connections_idle gauge
# HELP go_sql_connections_in_use The number of connections currently in use
# TYPE go_sql_connections_in_use gauge
(...)
A good practice is to not allow scrapping the stats from the whole Wild Wild Web. This can be prevented by adding a block in the reverse-proxy configuration . The vmagent scrapping process happens on my LAN and doesn’t pass through the reverse-proxy.
The VMAgent shipped in the VictoriaMetrics package allows grabbing (or scrapping) the metrics from the Prometheus end-points; whether it is the GoToSocial one or any other exporter ;-)
On OpenBSD, there is no provided rc.d(8) script to run vmagent in the background. But using the vmetrics script as a basis is rather simple. I also use a dedicated user and home directory to store its temporary data, configuration file and run it unprivileged.
# useradd -m -c "VictoriaMetrics agent" -d /home/vmagent \
  -g =uid -r 4000..5000 -s /sbin/nologin _vmagent

# cat > /etc/rc.d/vmagent
#!/bin/ksh

daemon="/usr/local/bin/vmagent"
daemon_execdir="/home/vmagent"
daemon_flags=""
daemon_user="_vmagent"
daemon_logger="daemon.info"

. /etc/rc.d/rc.subr

rc_bg=YES
rc_reload=NO

rc_cmd $1
# rcctl enable vmagent
# rcctl set vmagent flags -promscrape.config=/home/vmagent/prometheus.yml \
  -enableTCP6 -remoteWrite.url=http://localhost:8428/api/v1/write \
  -remoteWrite.tmpDataPath=/home/vmagent/tmp

# cat > /home/vmagent/prometheus.yml
global:
  scrape_interval: 10s

scrape_configs:
  - job_name: gotosocial
    metrics_path: /metrics
    static_configs:
      - targets:
#        - "[2001:db8::123]:8080@gts"
        - "192.0.2.123:8080@gts"
    relabel_configs:
      - source_labels: [ __address__ ]
        regex: '.*@(.*)'
        replacement: $1
        target_label: instance
      - source_labels: [ __address__ ]
        regex: '(.*)@.*'
        replacement: $1
        target_label: __address__
# rcctl start vmagent
Note that the relabel_configs section is not strictly required. I use
it because I want to be able to register a hostname in VictoriaMetrics
than may not always be the real server hostname.
Rendering GoToSocial metrics using Grafana
A VictoriaMetrics data source is added from the Grafana Web UI in
section /connections/datasources. Nothing special to do, it’s pretty
straightforward. Click the “Add new data source”, select the
“Prometheus” type and fill-in the proper parameters. I use:
- Name = VictoriaMetrics
- Prometheus server URL = http://victoria.example.com:8428
- Prometheus type = Prometheus
- Prometheus version = 2.24.x
- Cache level = Medium
- HTTP method = POST
The dashboard looks like this:
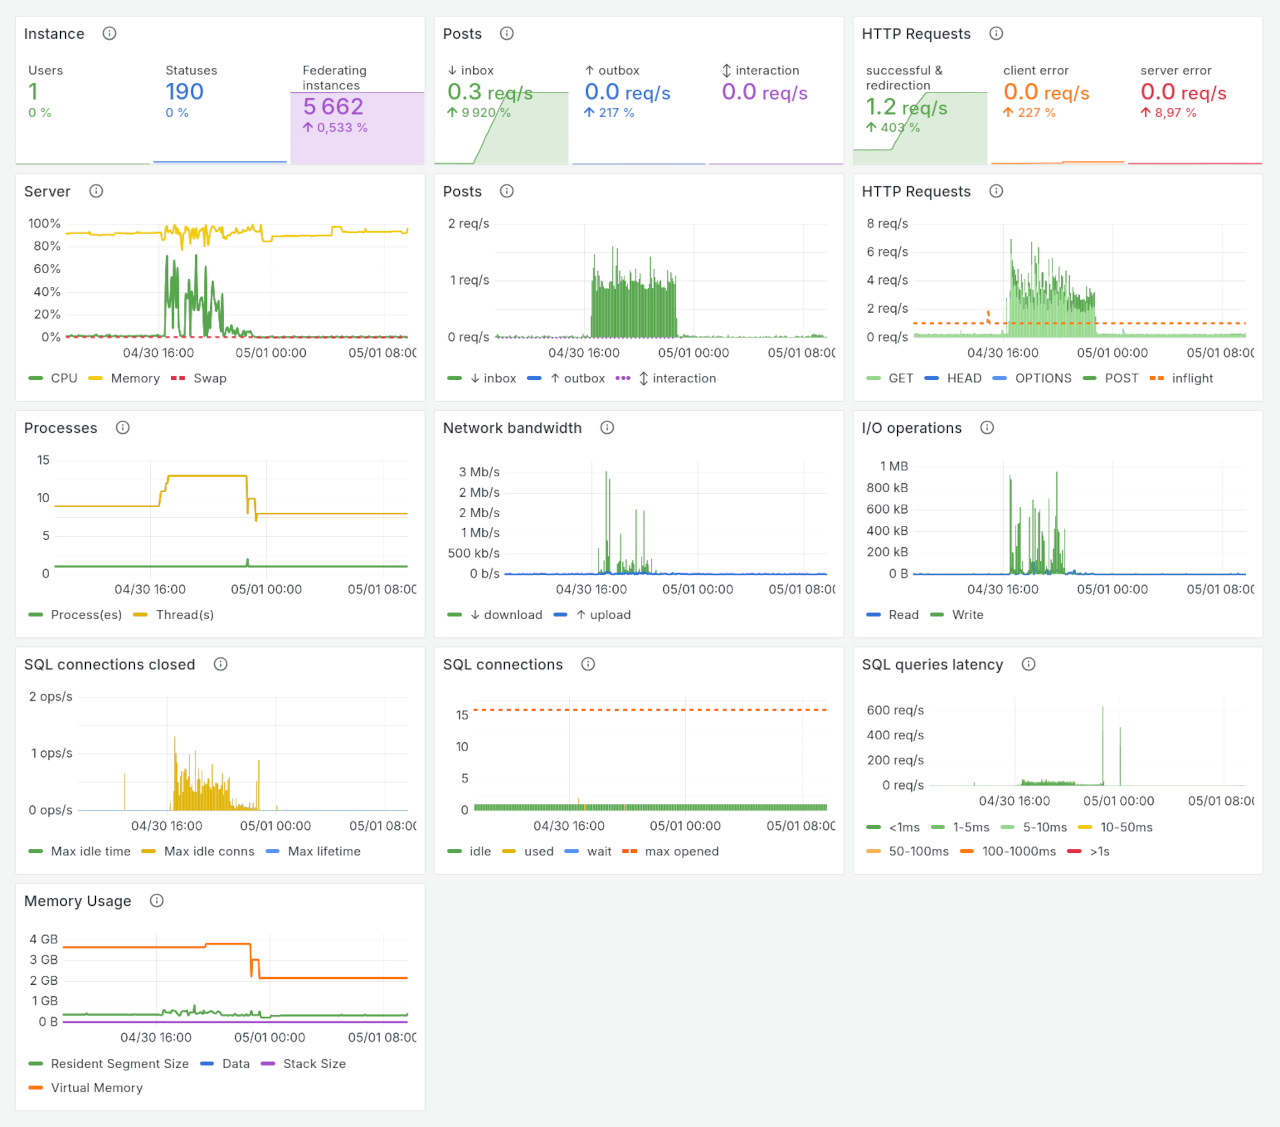
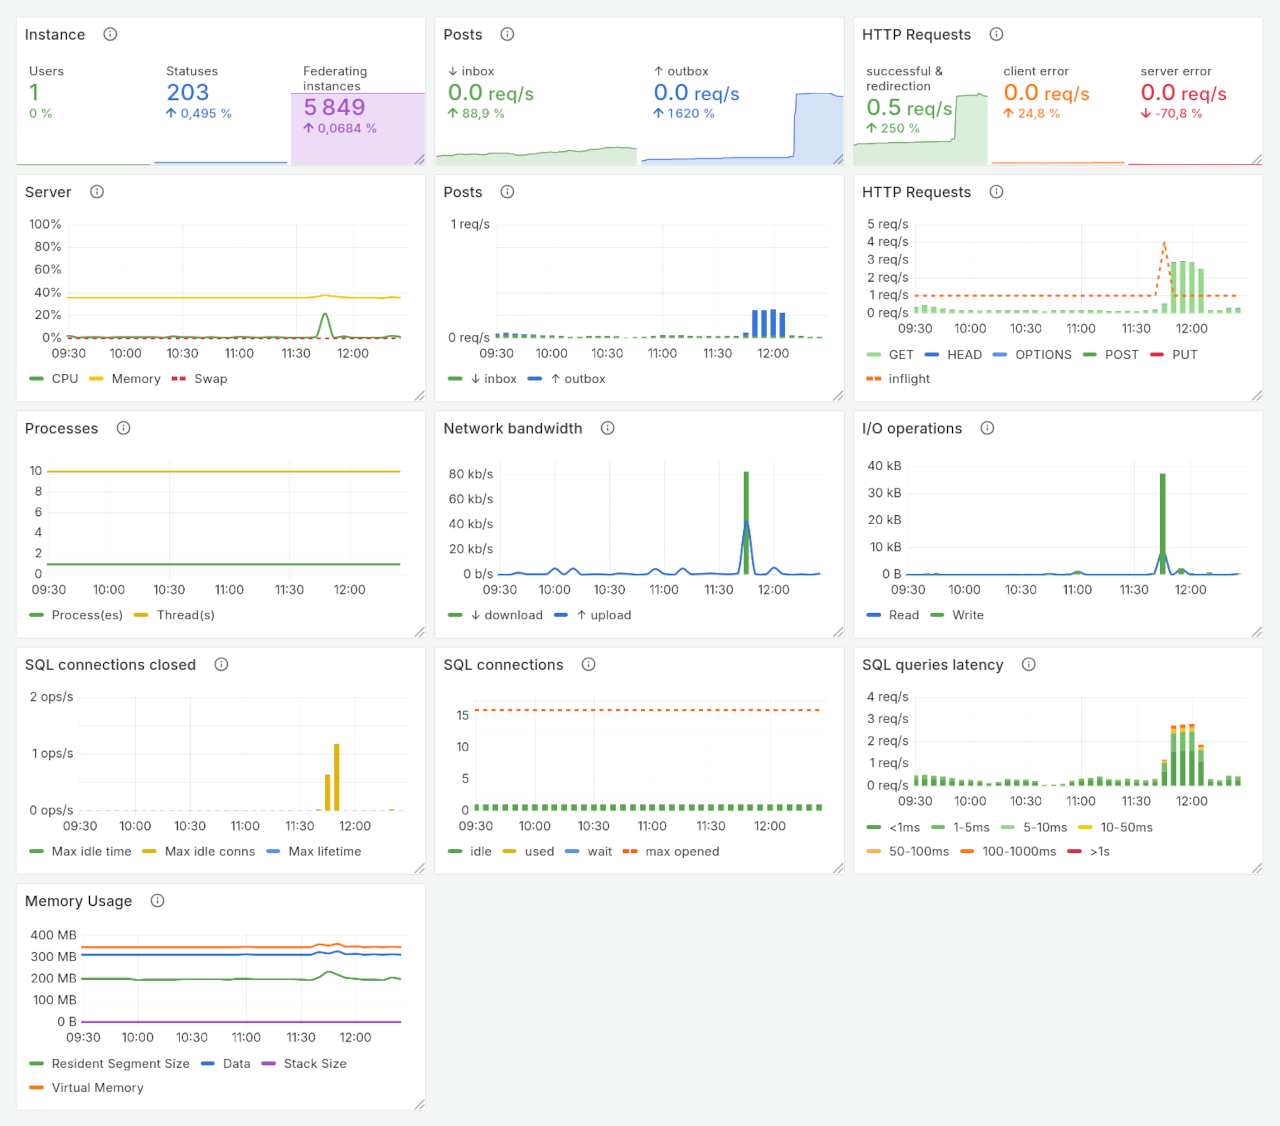
It use both output from collectd and GoToSocial. There are variables that allow selecting the host, based on query targeting the GtS metrics, and the main network interface. There is also a hidden variable that allows getting bars depending on the time range that is selected.
It can be imported from the Grafana dashboards website or downloaded directly as a JSON file from here .
It was initially build using only Prometheus. So if that’s your stack, you “just” have to modify the PromQL expressions, labels etc. And sorry, no, I didn’t keep the original dashboard queries ;-)
One more thing, GoToSocial on *BSD
The initial reason for this dashboard is that I have a GtS instance running on various BSD systems. It is used for communication regarding my public SearXNG instance and is therefore not that critical. At least not enough that I can accept weird behaviour. But it the end, there are no weird behaviour.
In the past months, I have been running GoToSocial using the official NetBSD and FreeBSD binaries. Recently, I compiled it from source to have it running on OpenBSD, using nowasm. I wanted to see if those OS behave differently. Spoiler alert, with my tiny instance, they nearly don’t.
NetBSD and FreeBSD binaries are both compiled the supported way, using wasm - which basically means, they ship with their ffmpeg binary and deal with SQlite connections the same way. In both configuration, GtS Resident Segment Size is about 300-500MB, while Virtual Memory is about 2-3GB. The CPU usage has not been seen above 20%; expect when compiling the wasm stuff at first start.
OpenBSD is a bit different. The wasm compilation doesn’t work. Go basically complains that it doesn’t know how to compile the required stuff. Compiling OpenBSD with nowasm requires sqlite3 and ffmpeg+ffprobe on the system. Hopefully, those are available in the system and in the ports. Memory usage is then seen to be very low. RSS is about 200MB and VM is about 200 MB. But the CPU usage seem to be more intensive when in/out requests happen. Not sure if this is because of the way OpenBSD provides SMP or if this is internal to Go.
A plan to migrate my current Mastodon instance to GoToSocial, sometimes soon. I also want to migrate some of my other accounts there. This would be the opportunity to see what happens when there is more traffic.
Anyway, that’s all for today. And don’t forget to #RunBSD !